 By David R. Hines, CFA, Director of Research
The equity bull market picked up pace last year. The S&P 500 returned nearly 33%, its best year since 1997. While business fundamentals did improve over the course of the year, the majority of stock market returns resulted from expanding valuations.
High valuations raise the risk for equity investors. Rising interest rates and falling profit margins are two factors that could threaten market valuations. We begin this note by explaining one of the methods we use to estimate fair value. We conclude the note with actions we are taking in client portfolios to mitigate current risks to market valuations.
The profitability of a business has a direct impact on its value. It is common sense that a company with a high profit margin is worth more in relation to its sales than a company with low profit margins. We use a simple method to determine whether a company represents good value. We compare the company’s valuation by using its price/sales ratio to its net profit margin. We define net profit margin as net profit to total sales.
We use three examples to illustrate this concept. First, we assume that the cost of capital for all three companies is 8%. Company A’s profit margin is 8%. It earns exactly what it costs to fund the company. The company is worth what it earns in revenue or 1x sales (8%/8%=1). Company B has profit margins of 16%. It earns double its capital cost. Company B’s value is 2x annual revenue (16%/8%= 2). Company C has profit margins of 4%. Its value is 1/2 its annual revenue or 0.5x sales (4%/8%=0.5). We use this simple model in our research process to make an initial assessment of a company’s valuation. This model suggests a value for company in a “steady-state” assuming no additional growth of revenue.
This model is useful to determine relative value for the market as a whole. The chart below looks at the S&P 500 Index as if it were a single business going back to 1955. For price it uses the combined market value of the 500 largest publicly traded US companies. For sales it uses total combined sales of those companies. The current ratio (as of 12/31/2013) is 1.71x. As one can see from the chart below (click to enlarge) the ratio is currently high. Using this measure the overall market appears expensive, or at least valued to return lower than average future returns.
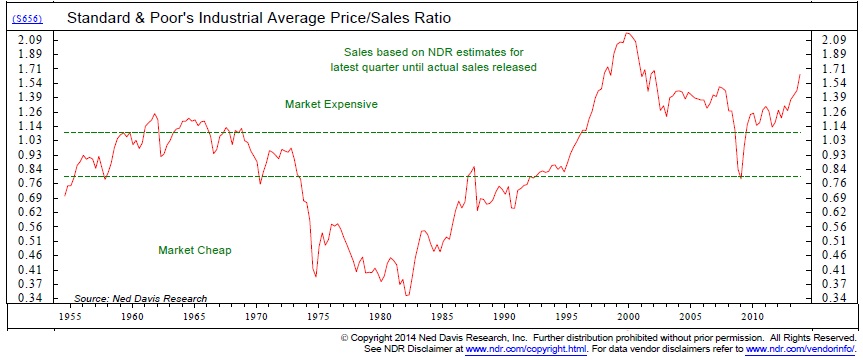 Our simple model confirms this high valuation. Long-term average corporate profit margins are approximately 6.5%. The corporate cost of capital (estimated here by the Baa Corporate Yield) is approximately 7.5%. Applying the model, the “no-growth” value of the market should be about 0.9x revenue (6.5%/7.5%). With the current ratio being about 1.71x revenue, the market does indeed look expensive.
Low interest rates could mean low capital costs resulting in higher profit margins. If interest rates stay low, profit margins could remain elevated for some time. As rates eventually rise, however, capital costs will rise forcing profit margins down. Rising rates and falling profit margins would have a direct negative impact on stock market valuations. We view this as a major risk.
We continue to position our portfolios to guard against these risks. While valuations and profit margins on average are high, we can still find enough companies with which to construct high quality portfolios. To guard against a likely decline in profit margins, we look for companies in strong competitive positions. These well-positioned companies have high and stable margins.
Within this subset of high quality companies, we look for valuations that make sense. As we have pointed out in earlier communications, many of these companies have lagged the index over the past 18 months and are trading at below-market valuations. We reason that a portfolio of companies with superior fundamentals and attractive valuations should hold up relatively well in a market correction, as quality portfolios do.
Market Log- January 24, 2014
S&P 500: 1790.29
10 year T-Note: 2.72%
Crude Oil: $96.90
Gold: $1,252.50
If you have questions or comments regarding this or any other communication from us, please email us at hmpresearch@hmpayson.com.
This commentary is prepared by H.M. Payson for informational purposes only and is not intended as an offer or solicitation for the purchase or sale of any security. The information contained herein is neither investment advice nor a legal opinion. The views expressed are those of H.M. Payson as of the date of publication of this report, and are subject to change at any time due to changes in market or economic conditions. The comments should not be construed as a recommendation of individual holdings or market sectors, but as an illustration of broader themes. H.M. Payson cannot assure that the type of investments discussed herein will outperform any other investment strategy in the future, nor can it guarantee that such investments will present the best or an attractive risk-adjusted investment in the future. Although information has been obtained from and is based upon sources H.M. Payson believes to be reliable, we do not guarantee its accuracy. There are no assurances that any predicted results will actually occur. Past performance is no guarantee of future results. Registration with the SEC or with any state securities authority does not imply a certain level of skill or training. All Content © 2014 HM Payson
In the face of elevated stock market volatility, rising US-China trade tensions,…
Maine Huts & Trails provides outdoor excursions in beautiful Western Maine, boasting…