 Click on the image at left for printer-friendly version…
By David R. Hines CFA, Director of Research
Last year proved a tough performance comparison in many of our client portfolios. While we realized strong absolute performance, portfolio returns lagged the S&P 500, generally (as we shall describe in this note). The miss against the S&P is not surprising in view of the nature of the 2012 rally, namely, a move driven by factors other than fundamentals and chiefly in lower quality, cyclical companies. Our investment discipline keeps us invested in high quality companies with stable cash flows so in 2012 our portfolios were invested in a broad segment of the market that under-performed relative to their lower quality brethren.
While the US equity markets have carried the momentum from 2012 into the current year, this note will examine more deeply the numbers behind the move and the wide range of results that occurred among investment styles and companies (large vs. small). In our view, and in part as a function of their outsized returns last year, cyclical companies with lower quality fundamental characteristics today are selling at premium valuations, raising questions about the sustainability of this valuation dichotomy.
Table 1 is a matrix that divides the top 1,500 domestic companies across a range of investment style and size. Briefly, ‘Style’ (on the horizontal axis) delineates companies by characteristics such as price multiples while ‘Capitalization’ (on the vertical axis) groups stocks according to the total market value of their shares. At a glance one can see, while they posted excellent absolute returns, large capitalization growth companies underperformed Value companies by as much as 4.4% in 2012.
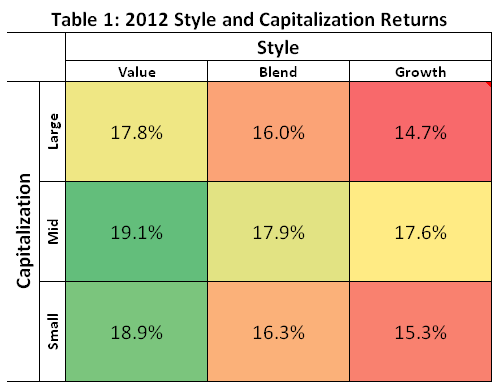
It is important to note that we use style and size characterizations only to analyze past performance. As we described in detail in the latest issue of our newsletter, Perspectives “It’s More Than a Matter of Style”, we do not view the investment universe this way. Our view has always been that growth and value are two sides of the same valuation exercise.
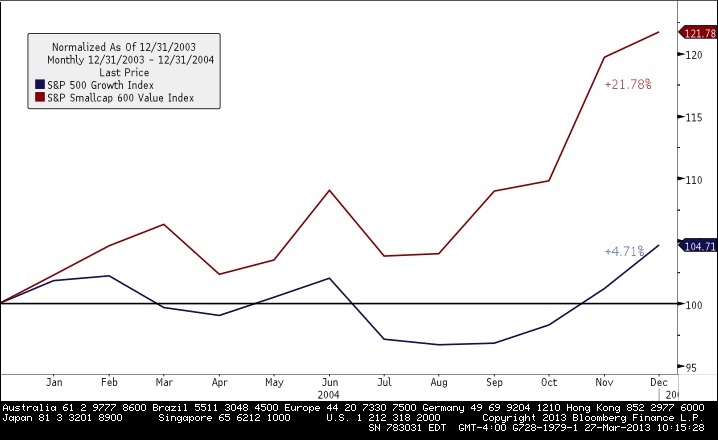
The difference in last year’s performance among investment styles has garnered a fair amount of analysis in the financial press. As to what might explain these differences, one reasonable thesis suggests the Federal Reserve has kept both short and long term interest rates at historic lows for such a long time investors have moved into riskier assets in pursuit of a return higher than cash. We observed a similar rush into cyclically sensitive companies in the several years leading up to the liquidity crisis of 2008. In 2004, for example, the S&P Large Cap Growth Index underperformed the S&P Small Cap Value Index by over 17%! We all remember vividly how this era of risk- taking in an easy money environment ended a few years later.
The 2012 performance of home builders and automobile manufacturers, historically two notoriously cyclical industries, provides a good example of the relative performance gap. The 2012 total return of the Dow Jones US Home Construction Index was 79% and the NASDAQ Global Auto Index was up 29%. This contrasts sharply with the 14% total return in the S&P Global Consumer Staples Index which, in our view, is a much higher quality index of large capitalization companies with high and stable margins.
Our investment process emphasizes companies producing high cash flows based on high quality balance sheets. From a portfolio perspective, we want our clients to own companies which, on average, have strong margins and better growth, yet trade at or below the average valuation multiple of the S&P 500 (as illustrated in Table 2).
Here we compare the quality, growth characteristics, and valuations of the HM Payson “Growth of Income” portfolio with both the S&P 500 and the S&P 500 Small Cap Value Indexes. We use our “Growth of Income” model as a proxy for a typical client portfolio. Our metrics for the measurement of quality are return on equity (ROE) – a measure of the return on shareholders’ investments, and how variable this return is over time.
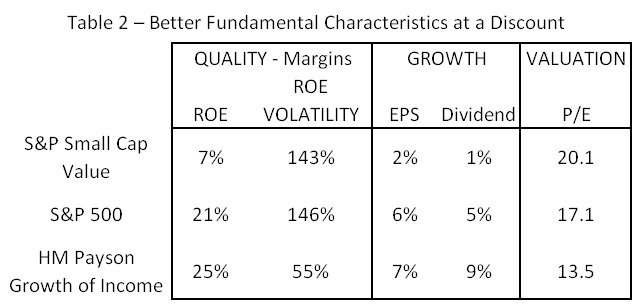
The key take away from this table is that our client portfolios are comprised of companies that can fundamentally outperform the average company both in profit quality and in growth. Importantly, we are able to buy these companies at attractive prices. We also observe that investors are currently paying a premium for ‘riskier’ companies on average: companies with more levered operating margins and volatile prices.
The cornerstone of our investment philosophy is that fundamentals drive returns over the long run. There are periods of time, however, when factors other than fundamentals drive returns. Our process prevents us from chasing returns in overpriced stocks; and there are periods of time, such as last year, where our long-term perspective becomes out of sync with the market. We believe, however, our client portfolios are well positioned for the eventual reversion to equity markets wherein strong fundamentals dominate other factors contributing to market returns.
Market Log- March 26, 2013
S&P 500: 1,563.77
10 year T-Note: 1.92
Crude Oil: $96.00
Gold: $1,600.00
If you have questions or comments regarding this or any other communication from us, please email us at hmpresearch@hmpayson.com
This commentary is prepared by H.M. Payson for informational purposes only and is not intended as an offer or solicitation for the purchase or sale of any security. The information contained herein is neither investment advice nor a legal opinion. The views expressed are those of HM Payson as of the date of publication of this report, and are subject to change at any time due to changes in market or economic conditions. The comments should not be construed as a recommendation of individual holdings or market sectors, but as an illustration of broader themes. H.M. Payson cannot assure that the type of investments discussed herein will outperform any other investment strategy in the future, nor can it guarantee that such investments will present the best or an attractive risk-adjusted investment in the future. Although information has been obtained from and is based upon sources H.M. Payson believes to be reliable, we do not guarantee its accuracy. There are no assurances that any predicted results will actually occur. Past performance is no guarantee of future results. Registration with the SEC or with any state securities authority does not imply a certain level of skill or training. All Content © 2013 HM Payson
In the face of elevated stock market volatility, rising US-China trade tensions,…
Maine Huts & Trails provides outdoor excursions in beautiful Western Maine, boasting…